
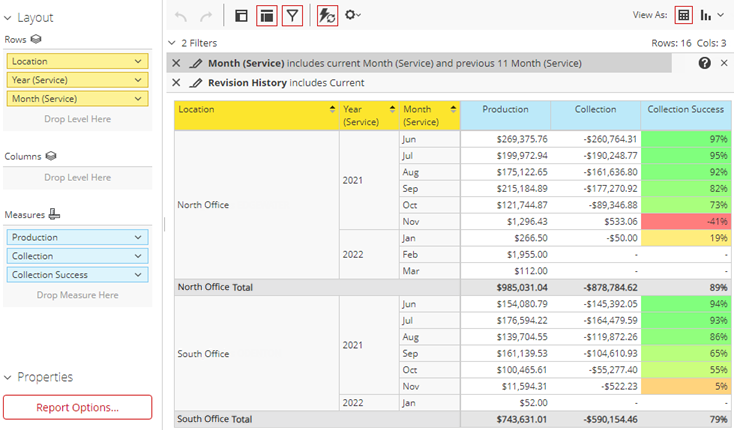
The Collection Success Report displays the successfulness of collections as a percentage (the collections divided by the production) over the last 12 months across multiple locations. For each location that you have permission to view, the report displays the production, collections, and success percentage by month and totals. To make it easier for you to see the relative success from month to month, the percentages are shaded: greener is better; redder is worse. You can customize the default report as needed.
Note: The report includes prepayments and unallocated amounts as part of collections.
To generate the report
-
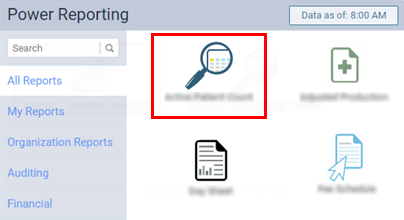
On the Home menu, under Reports, clicktap Power Reporting.
The Power Reporting page displays.
-
ClickTap the Collection Success icon.
The report displays.
-
(Optional) To view the time when the next sync is expected to occur, clicktap Data as of.

-
Using the analysis report builder tools, add data fields to the layout, and set up the filters as necessary.
-
To save the report as a template for later use, clicktap Save.

-
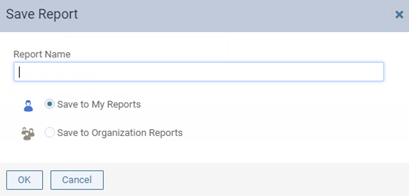
When prompted with a Save Report window, enter a name for the report, select whether you want to save the report as one of your reports (available only to you) or as an organization report (available to all users), and clicktap OK.
-
From the More actions and options
 button menu, select an Export option to export the report as a .pdf, .xslx, or .csv file.
The data from your database syncs with the reporting system automatically and displays the time of the last sync on the Data as of button. Data entered in Ascend Academic after the time shown will not be available on the report until the next sync.
Comments
0 comments
Please sign in to leave a comment.